
Master Microsoft Power BI Easily: Fastest Way To Land Great Jobs!
A structured, project-based Power BI program designed to make you job-readyeven if you're starting from scratch.
No Experience Needed- Start from scratch and build up
Flexible schedule- Learn at your own pace
Develop job-relevant skills with hands-on projects
Lifetime Access with FREE upgrades
25654+ Enrolled
25654+ Enrolled

This course includes:
110+ Videos, 25 hours+ content
10+ Project & Exercises
Key Highlights

No coding/tech background needed

Flexible Schedule

Global Certificate of Completion
10+ Business Projects & case studies
Our Proud Associations & Awards

Power BI Course Overview
Master the Art of Data Visualization and Analysis
TopMentor comprehensive program equips you with the skills needed to harness the power of Microsoft Power BI for efficient data visualization and analysis. With a meticulously crafted curriculum spanning over 19+ hrs of training, our course covers everything from the fundamentals to advanced techniques, ensuring you're wellversed in Power BI's capabilities.
Explore the course below to understand its contents & discover why choosing TopMentor is a wise desicion.
Course Syllabus
i. What is Power BI
ii. Installing Power BI
iii. Power BI Walkthrough
iv. Introduction to Database
v. Introduction to Database Objects
vi. Installing SQL Server
vii. Installing Sample Database
viii. Introduction to Relational Database - Codds Rules
ix. Introduction to ER Diagram
x. Create Table and Insert and using SQL Server
xi. Reading content from the database
xii. Introduction to OLAP Database
xiii. Schema Modelling - Star v Snowflake
i. How to Configure SSMS & Sql Server DB Power BI 52
ii. Connecting to csv files X 7
iii. Practice - 1 with CSV file X 8
iv. Connecting to Excel file with data X 10
v. Connecting to Hidden Sheet in Excel X 4
vi. Connecting with Excel sheet with blank columns X 4
vii. Read password protected excel file X 3
viii. Read formula from excel X 6
ix. Practice - 2 with Excel Data X 12
x. Connecting to Folder of Data X 6
xi. Practice 3 with Folder Data X 11
xii. Connecting to Web Data (Github) X 5
xiii. WebData Practice X 21
xiv. Overview of Connecting to SQL Server X 6
xv. Connecting to SQL Server and Understanding the data X 12
xvi. Creating and Importing SQL Views X 12
xvii. Reading using SQL Command X 7
xviii. Connecting to ESPN CricInfo X 5
xix. Connecting to MYSQL DB X 6
xx. Connecting to SQLITE DB X 6
xxi. Connecting to Wikipedia X 4
xxii. Include or Exclude part of visualization
i. Creating line chart
ii. Stacked Bar chart
iii. 100% Stacked Bar Chart
iv. Creating Pie Chart
v. Donut Chart
vi. Area Chart
vii. Stacked Area Chart
viii. Line and Stacked Chart
ix. Line and Clustered Column Chart
x. Waterfall Chart
xi. Key Influencer Chart
xii. Funnel Chart
xiii. Gauge Chart
xiv. Ribbon Chart
xv. Sankey Chart
xvi. Card KPI
xvii. Multi Row Card KPI
xviii. Indicator KPI
xix. Bow Tie Chart
xx Treemap Chart
xxi. Advance Infographic
xxii. How to Change Aggregation or Calculation Type
xxiii. How to Create Matrix or Pivot Chart in Power BI
xxiv. How to Create and Conditionally Format Power BI Table
xxv. Animated Bar Race Chart
xxvi. Bullet Chart
xxvii. Tree based custom visualization
xxviii. Wordcloud visualization
xxix. Tornado chart
xxx. Visual For Natural Language Processing
xxxi. Show or Hide visualization on Dashboard
i. Create a new custom Power BI table
ii. Create a summarized table from existing table
iii. Connect Clean and Model Data in Power BI
iv. Create a New Measure Table in Power BI to Keep All Measures at one Place
v. Power BI Advance Date Filtering Tutorial with Example
vi. Create a New Table in Power BI from Existing Table Based on Filter Conditions
vii. Drill Through Filter Tutorial with Example to Connect Pages
viii. Create and Use Power BI Hierarchy
ix. Numeric Field Formatting and Conditional Formatting
x. Totals and Subtotals in Matrix or PivotTable
xi. Relative Date Filter Tutorial for Selecting Previous N Periods Range
xii. Visual vs Page vs Page All filters
xiii. Changing or Formatting Slicer - Filter Look & Feel to Buttons or Dropdown
xiv. How to Create Power BI Text Slicer - Filter and Formatting
xv. How to Create Date Slicer - Filter
i. Introduction to DAX
ii. DAX Functions
iii. Working with DAX
iv. Calculated Columns
v. Find Values for Every Last Day of the Year
vi. Date DAX Function DATESINPERIOD to Calculate Values in Relative Time Period Interval
vii. DAX function ClosingBalanceQuarter to find the value at the last day of quarter
viii. DAX Function ClosingBalanceYear to Capture Values on the Last of Year
ix. DAX Function DatesMTD and Calculation for Running Month To Date Cumulative Values
x. DAX Function DatesQTD and Calculation for Running Quarter To Date Cumulative Values
xi. DAX Function DatesYTD and Calculation for Running Year To Date Cumulative Values
xii. DAX Time Intelligence Date Add Function Calculation to Get Historical or Future Values
xiii. DAX Time Intelligence Date Function to Calculate Values Between Two Dates
xiv. Time Intelligence DAX function to find the value on last day of month
xv. DAX Implementation of Different Functions - Project
1 Building Dashboard 1 - Getting the Big Picture
6-2 Working with Call Center Data
6-3 Sales Insights Performance Dashboard
6-4 Data Quality Analytics
6-5 Customer Ageing Analysis
6-6 Building Dashboard with Map
Our Learners Experience
Join thousands of 10000+ STUDENTS who've transformed their careers with our program
Nithyashree
Data Scientist
Kunal Dhakate
Data Scientist
Arpita Basu
Data Analyst
Sakshi
Data Analyst

Pratyush
AI engineer
Garleen
Data Scientist
Pratyush
AI engineer
Garleen
Data Scientist
Sakshi
Data Analyst
Nithyashree
Data Scientist
Kunal Dhakate
Data Scientist
Arpita Basu
Data Analyst
Requirements
There are no requirements except a windows PC - no coding, no tech background needed!
PowerBI Projects
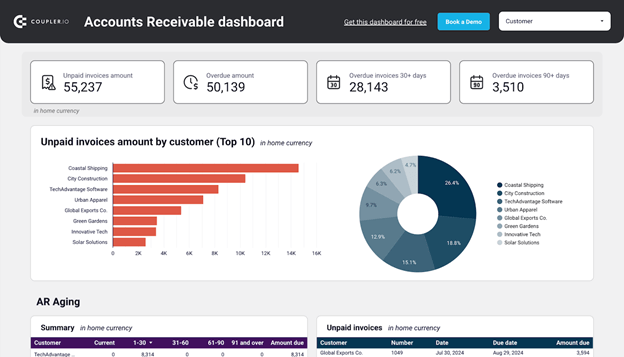
Customer Ageing Analysis (Accounts Receivable Intelligence)
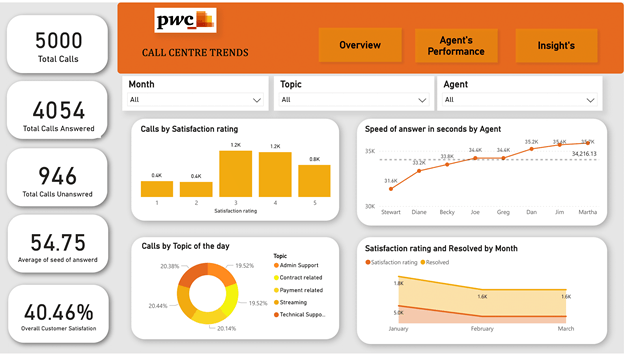
Call Center Data Analysis (Operations Optimization Dashboard)
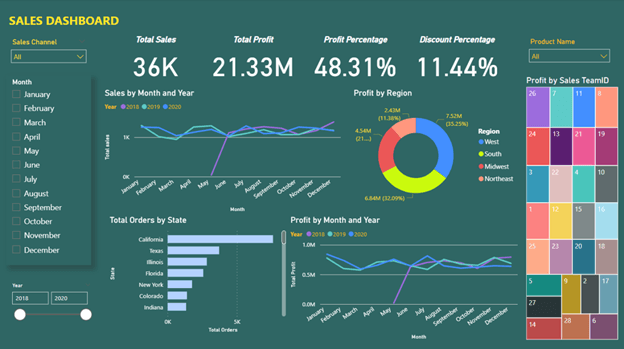
Sales Insight Performance Dashboard (Revenue Intelligence)
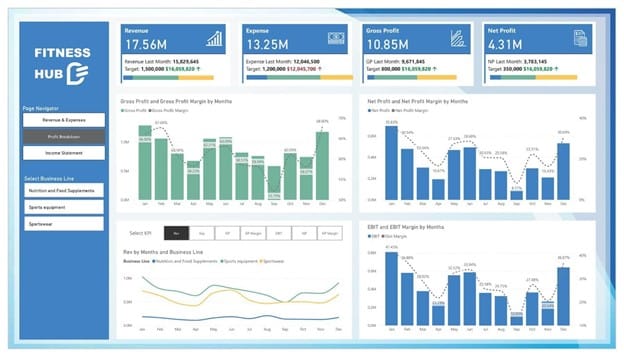
Company’s Financial Analysis (Executive Dashboard)
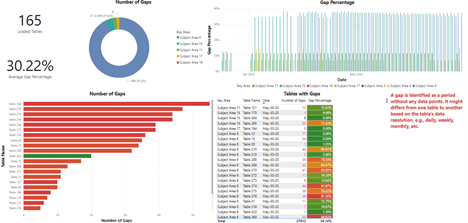
Data Quality Analysis (Data Cleaning & Reliability Dashboard)
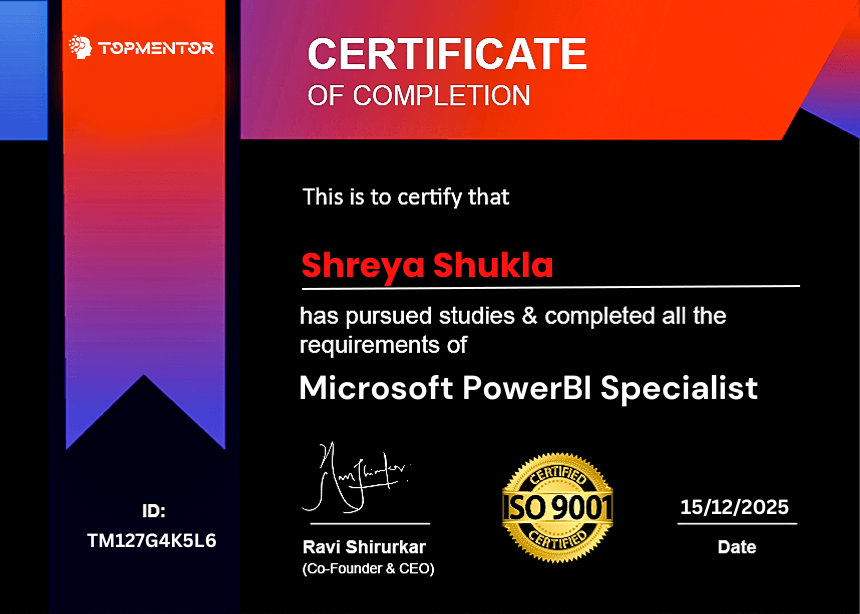
Certification of Completion
You receive a ‘Certificate of Completion’ signed and addressed personally by your guide and mentor.
Adding and sharing this certificate with your Resume/CV or on your LinkedIn profile will significantly boost the job prospects!
Unique Option: Option to upgrade into full placement programs after completing this course !
At TopMentor, our commitment doesn’t end with training —after completing powerbi course a student has option to upgrade into full placement programs such as data analytics, data science, genai, ai by paying just difference of fees! With upgrade, you can avail topmentor's premium programs with placements with following features.

ATS Friendly Resume Building

Linkedin Profile Optimization

Offering Career-Oriented Sessions

Mock interviews & Interview Prep
Highest rate of Placements in the industry: MidDay
TopMentor is a trusted Data & AI learning platform featured by the Times of India, with its founder recognized among ET Now & Times Group’s 40 Under 40 achievers. Thousands of learners rely on TopMentor for industry-relevant training, real projects, and career-focused mentorship.
25654+
Students Enrolled
48 Lacs+
Highest salary Recorded
128%
Average hike
98%
Avg. Placement Rate
Success Stories from our Students

"Top Mentor offers affordable, high-quality courses with personalized attention and practical projects. Their unique teaching methods and excellent placement assistance helped me secure a job at PayPal. Highly recommended for career growth."
Shubham Shah | DataAnalyst


The course was exceptional from day one. The content, lifetime video access, and the tutor's patience were amazing. It's perfect for anyone, regardless of background, and includes excellent resume and job support.
- Akash Sharma | Data Scientist


"I completed my Data Science Master's with Top Mentor in January. The support from day one was outstanding. Their teaching, resume tips, and interview prep helped me secure my dream job. If 30% was my hard work, 70% was thanks to Top Mentor's support."
Vaibhavi Bhadani | Data Engineer

Top Mentor is One of the best class to not only attend but to learn. They have the best courses and the best teachers, the teaching method is very unique and very effective. It was their team only who helped me to get placed at company like Paypal. .
Shubham Shah
Data Analyst
Right from day 1 it has been a wonderful journey. The course material, the accessibility to recorded video for lifetime,the maturity and patience of tutor all through the course was simply amazing.
Akash Sharma
Data Scientist
After training, tips for resume preparations, interview questions helped me a lot to get placed. I applied for around 120+ openings, many of them were provided by top mentor tie ups and finally got landed in my dream job where I started my journey towards becoming data scientist.
Vaibhavi Bhadani
Data Engineer
Frequently Asked Questions
This program is for people who are not satisfied with where they are right now.
● Freshers struggling to get their first job
● Professionals stuck in low-growth roles (BPO, sales, support, operations)
● Excel/MIS users who want to move into analytics
● Career switchers from non-IT backgrounds
If you’re serious about upgrading your career with a practical, in-demand skill — you’ll fit in.
Yes — and most of our learners start exactly there.
But don’t fool yourself:
You don’t need coding experience, but you do need consistency.
People who treat this casually don’t get results.
People who follow the structure, complete projects, and practice — do.
Because we focus on skills + outcomes, not inflated branding.
Most platforms charge more for:
● Recorded content
● No mentorship
● No real projects
We’ve optimized delivery and cut unnecessary costs — not the quality.
If you think “expensive = better,” you’ll overpay elsewhere.
If you care about ROI, this makes sense.
Free content gives you information.
This program gives you structure + execution + accountability.
Here you get:
● Step-by-step roadmap
● Real-world projects (not toy examples)
● Guidance on what actually matters in interviews
● A system that forces you to finish
Most people don’t fail because of lack of content.
They fail because they never complete anything.
What you will get:
● Job-ready skills
● Portfolio projects
● Interview preparation support
Your results depend on:
● how seriously you follow the program
● how consistently you apply
We give you the leverage — you still have to use it.
Please note that our powerbi program is not full job assistance program. If you want full job
assistance program then visit topmentor.com and explore our high end live programs.
You can start building projects within the first few weeks.
Most serious learners:
● become confident in 4–8 weeks
● start applying within 6–10 weeks
But if you drag it, delay it, or stay inconsistent — it’ll take forever.
Yes — because knowing tools ≠ knowing how to solve business problems.
This program focuses on:
● real-world datasets
● end-to-end project thinking
● how companies actually use dashboards
Most “basic learners” are stuck because they never move beyond tutorials. This fixes that.
You won’t be left figuring things out alone.
You’ll get:
● Mentor support
● Guidance when you’re blocked
But again — support only helps people who actually ask questions and stay engaged.
Minimum: 1 hour per day
If you’re expecting results without putting in time, this won’t work.
The people who win here are not the smartest —
they’re the most consistent.
Nothing changes.
You stay:
● In the same job
● At the same salary
● With the same frustration
The market is moving fast toward data and AI.
Waiting doesn’t make it easier — it just makes you more replaceable.
Welcome to TopMentor
- A School of Wealth Creation!

CONTACT US
Phone: +91 7498949392
Email: support@topmentor.com
Copyright ©2026 Top Mentor
Lorem ipsum dolor sit amet, consectetur adipisicing elit. Autem dolore, alias, numquam enim ab voluptate id quam harum ducimus cupiditate similique quisquam et deserunt, recusandae.
Book Your Consultation
We HATE spam. Your email address is 100% secure